Please see the VoroTop Tutorial Through Examples for hands-on lessons for learning how to use VoroTop. Through carefully designed examples, you will learn to perform various types of Voronoi topology analysis, starting from basic calculations to more advanced techniques.
Defect IdentificationVoroTop can be used to identify defects in high-temperature systems without the need for quenching (such as through energy minimization). The example below illustrates the migration of a pair of screw dislocations inside an FCC aluminum crystal heated to 95% of its melting temperature.
We can identify these dislocation by filtering out all atoms with face-centered cubic local structure. Of the remaining particles, we use the cluster-analysis feature of VoroTop to identify the large clusters which are the dislocations. The video below shows the manner in which these screw dislocations migrate towards each other and self-annihilate.
The video above shows a pair of dislocations in the aluminum crystal. Atoms whose local environment is that of the FCC crystal are not colored. Remaining atoms belonging to the dislocations are colored according to their z-coordinate. The 20-second video depicts a 13 picoseconds time-window. Additional details about the simulation can be found in this paper (preprint) about VoroTop.
MeltingVoroTop is uniquely suited to study high-temperature phenomena. The video below shows the slow growth of a single non-crystalline region inside a super-heated crystal. An FCC Lennard-Jones crystal is heated to roughly 105% of its melting temperature. No atoms were quenched to produce this video.
The video above shows a picture of a (111) plane in the crystal. Atoms whose local environment is that of the FCC crystal are colored yellow. Atoms whose local environment are not FCC are considered non-crystalline and are colored red. Atoms colored dark blue belong to a large critical nucleus in this system. Atoms might be connected to the central non-crystalline region though appear disconnected in this particular field of view.
The video below shows that same system but from a different point of view. In this video, atoms that are locally crystalline are not shown. Non-crystalline regions with more than 100 atoms are shown in grey. The single-largest non-crystalline region is shown in color, for contrast.
The 26-second video depicts a time-window of 750 LJ time units. Even after the system has completely melted, a small fraction of the atoms have local FCC structure.
Grain Boundary CharacterizationVoroTop can be used to study the structure of bulk and defect structures. Here we consider distinct metastable grain boundaries that share the same five macroscopic degrees of freedom, but in which the adjacent crystals differ in their relative alignment and atomic density at the grain boundary. We use VoroTop to calculate the topological types of all atoms and color each atom by topological type. The boundaries considered here are ∑5 symmetric tilt boundaries that occur in a BCC tungsten bicrystal.
The three relaxed systems, in a LAMMPS dump format are available here (B1,B2,B3). The filter used to color these atoms is available here, and further described on the Download page. The AtomEye cfg files were generated using VoroTop using the following commands:
./VoroTop dump.36d87_S005_2B1 -f B123.filter

./VoroTop dump.36d87_S005_2B2 -f B123.filter

./VoroTop dump.36d87_S005_2B3 -f B123.filter
These samples were created by Jian Han (UPenn).
Grain Boundary Transformation via DefectsHere we study how a grain boundary transforms under the absorption of defects. The initial structure is the same as the B1 structure in the previous example, and the sample is heated, and interstitials are added randomly inside the grain boundary.
We can clearly see the evolution of the grain boundary in response to the addition of interstitials at the boundaries. Click here to see the migrations of vacancies and interstitials in the bulk near the interfaces.
High Temperature PolycrystalOne strength of the complete topological approach towards structure characterization manifests in visualization of high-temperature systems. Here we consider an FCC nickel polycrystal at 1350 K, roughly 85% of the bulk melting temperature. The grain-boundary microstructure is perfectly clear, as are numerous twin boundaries, vacancies, and other defects.
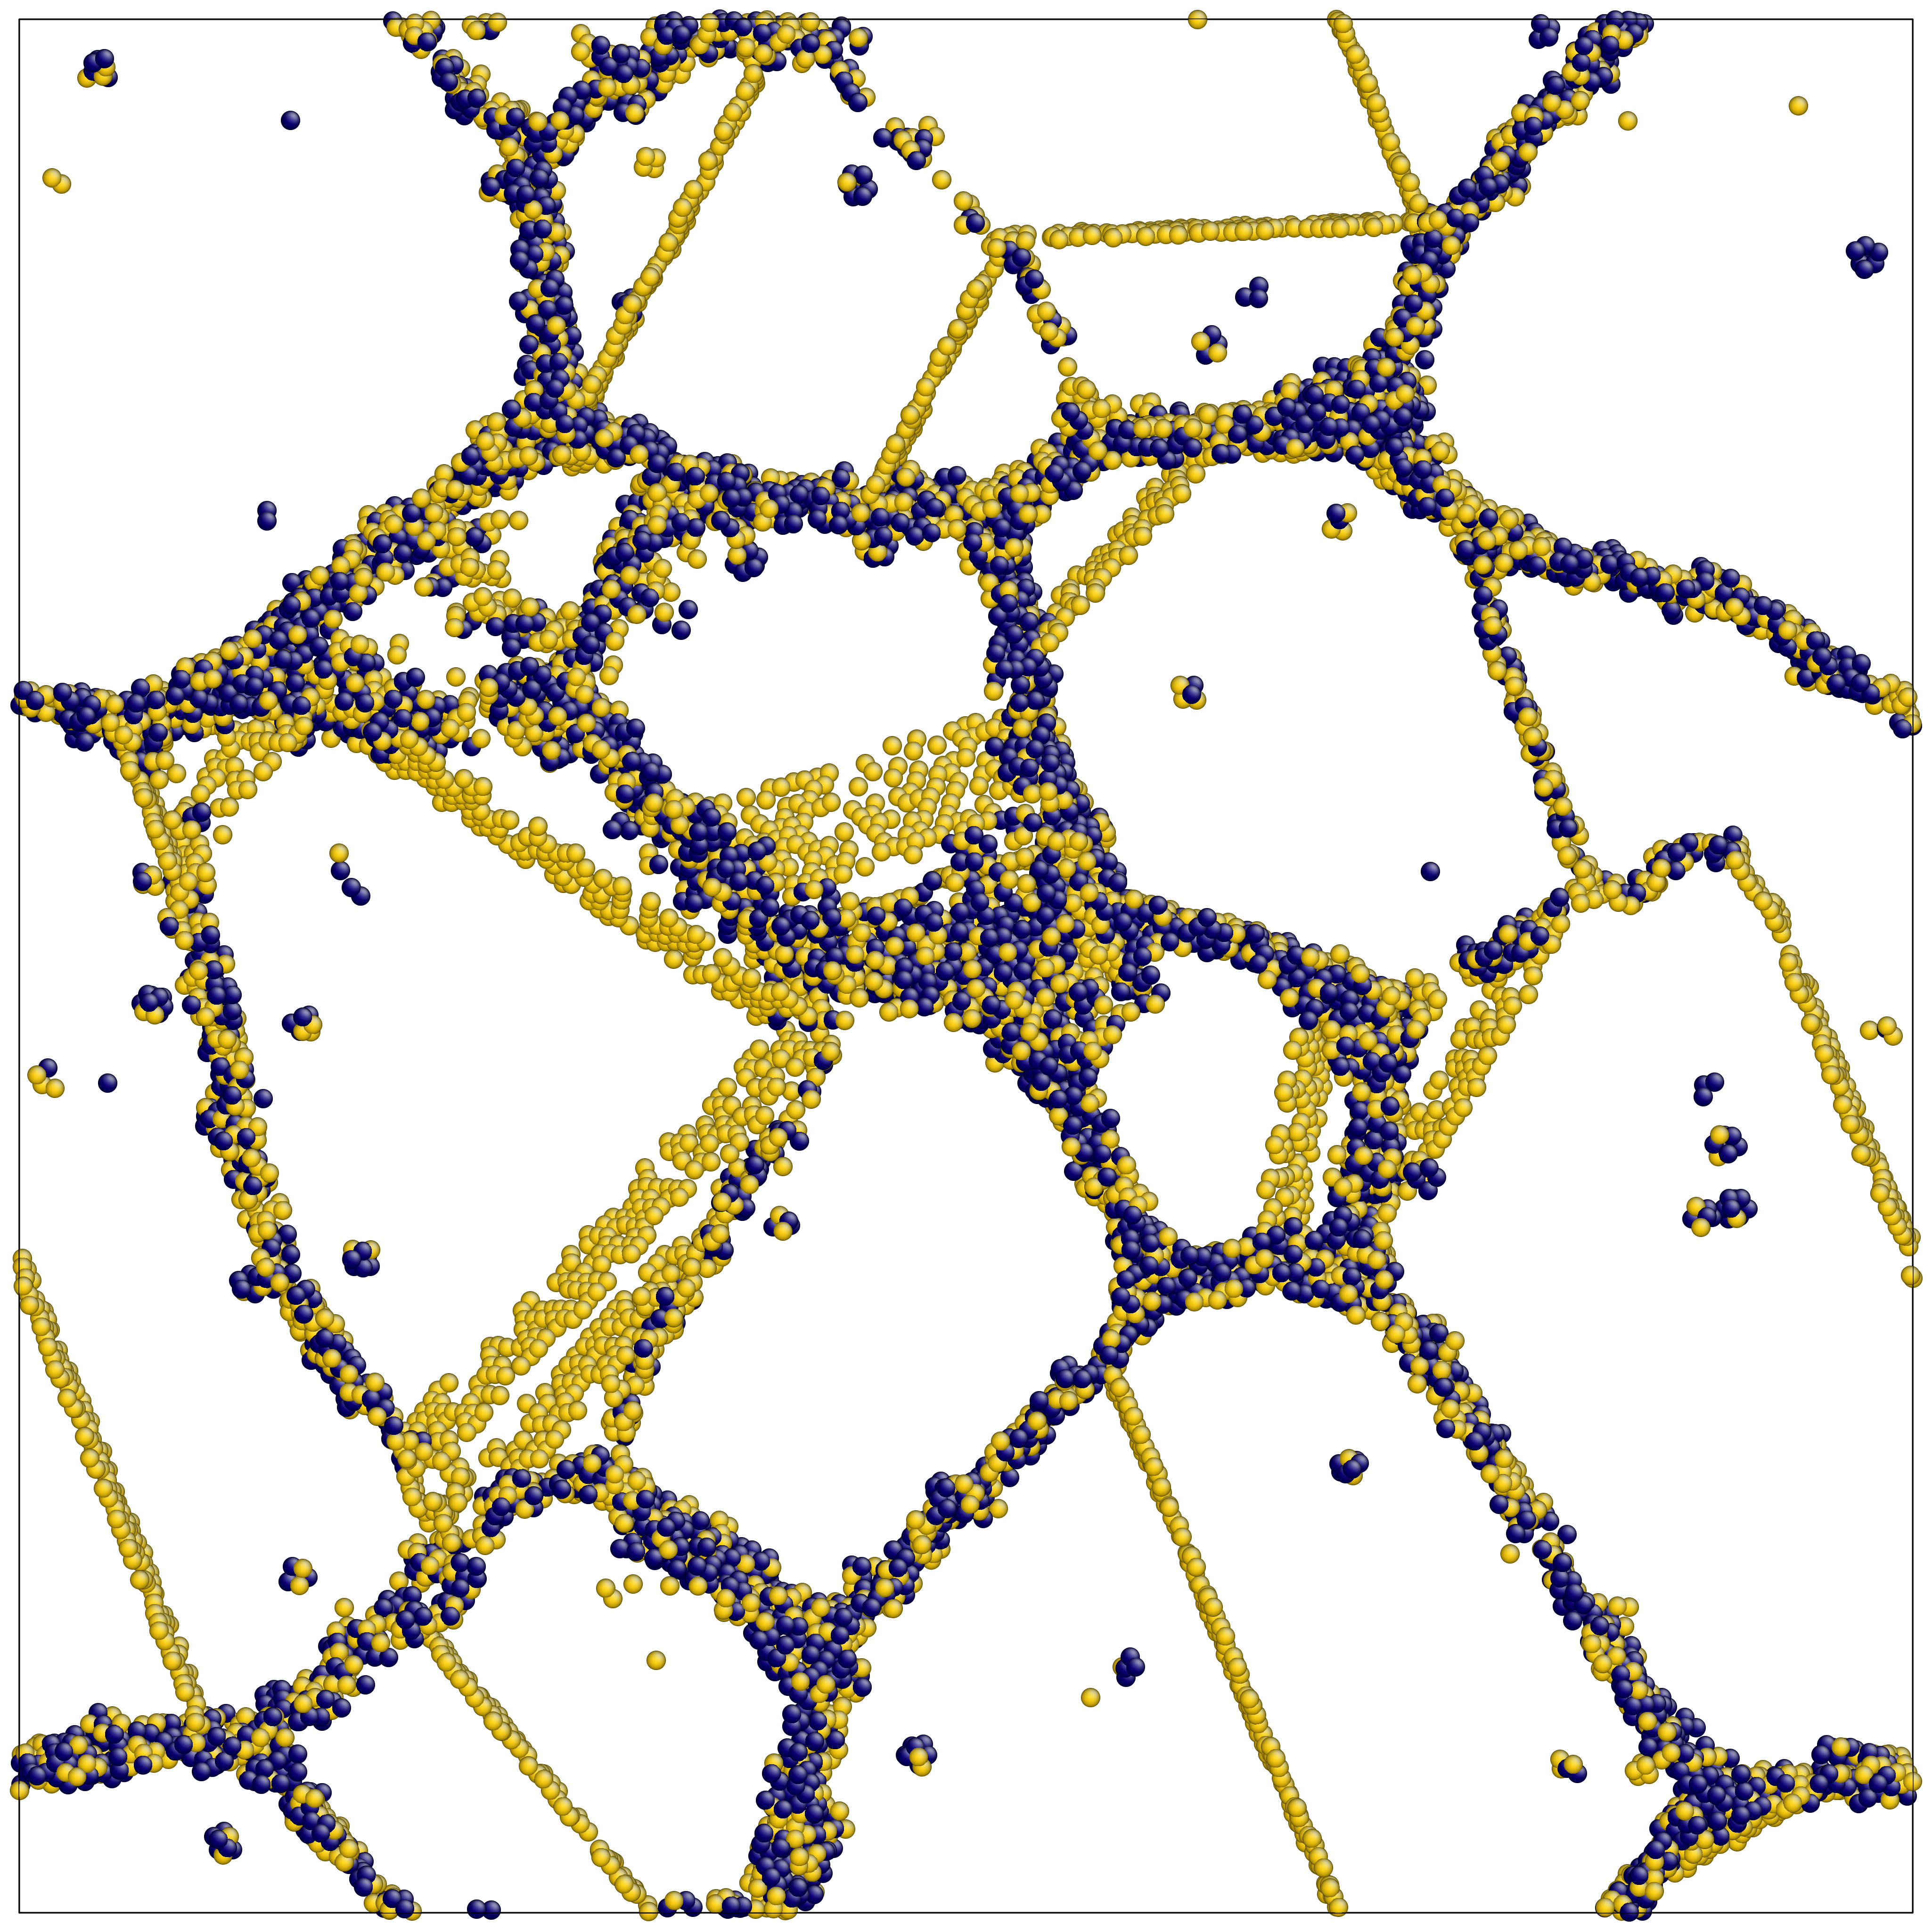
This system in its original AtomEye cfg format contains slightly more than 5 million atoms. The FCC-HCP filter was used to identify bulk FCC local structure, HCP local structure, and other defect structure. The following command was used:
./VoroTop unquenched.1300000.cfg -f FCC-HCP.filter
In the resulting file, atoms with bulk FCC local structure are assigned structure type 1 (not shown in above figure) and those with HCP local structure are assigned structure type 2 (colored gold); all other atoms are assigned local structure type 0 (colored blue), corresponding to general defect structure. This sample was created by Spencer Thomas (UPenn).
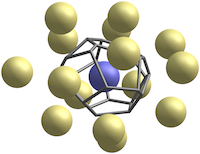
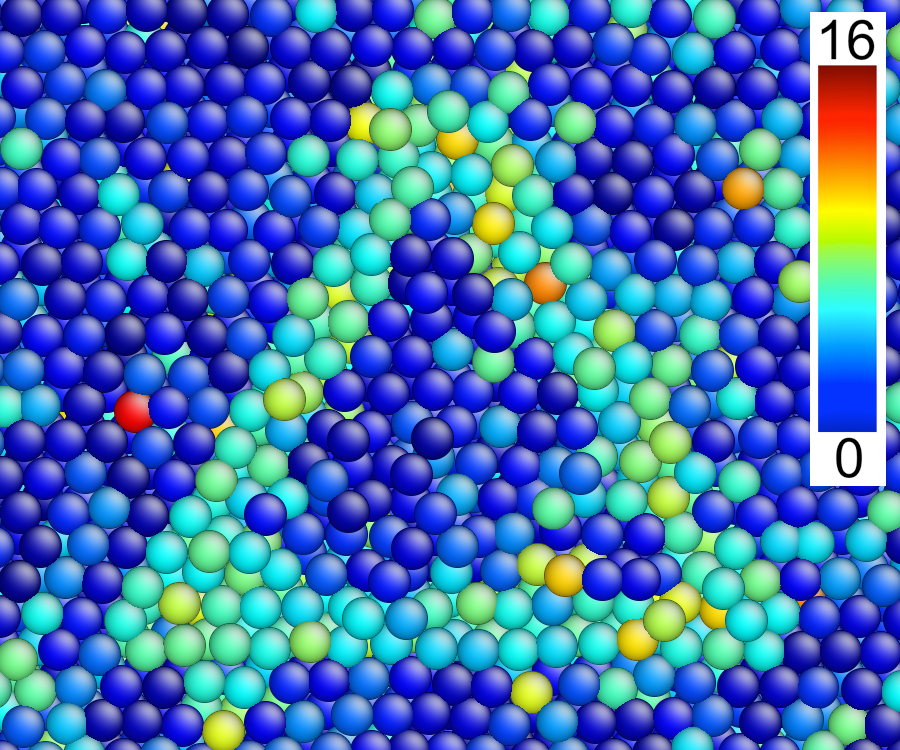
Stacking Fault TetrahedronStacking fault tetrahedra (SFT) are a type of three-dimensional defect found in face-centered cubic metals. These defects typically form at temperatures at which conventional visualization techniques fail. Below is a picture of a copper sample in which a SFT has formed; the sample of copper is 1200 K, over 80% of the melting temperature. On the left the sample is colored using centrosymmetry; on the right it is colored using Voronoi topological types.
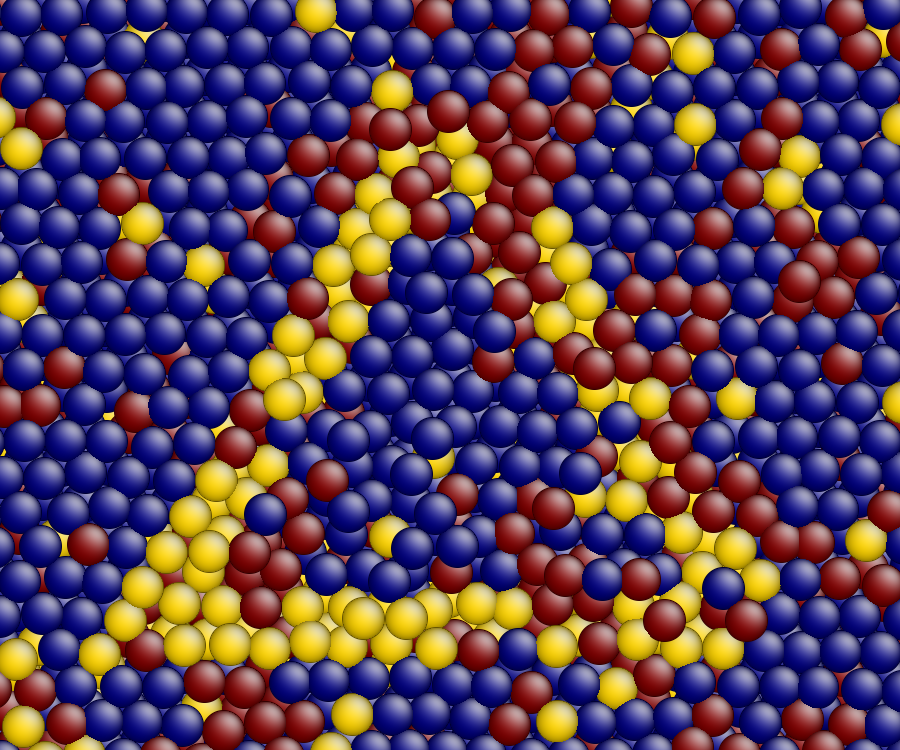
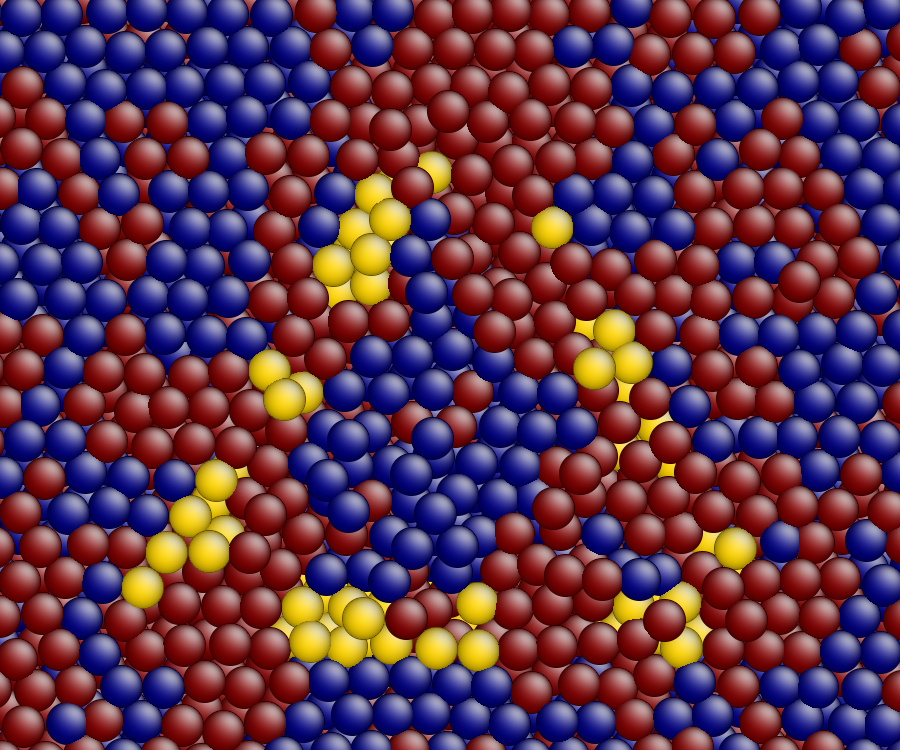
In the second, third, and fourth figures, dark blue, yellow and red indicate atoms in FCC, HCP, and other local environments, respectively. The sample is cut through the center of the tetrahedron, and so cross-sections of three stacking fault planes can be seen. Atoms in these stacking fault planes look, locally, like HCP.
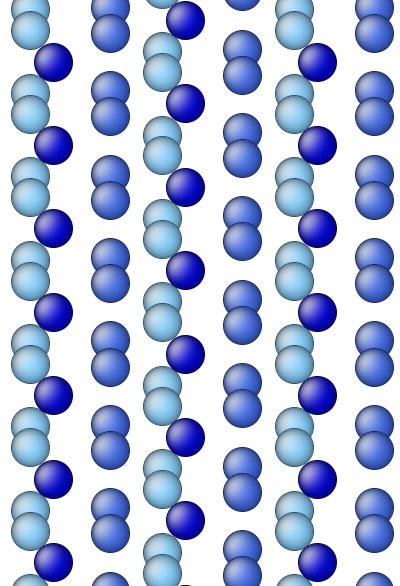
AnnealingIn the example below, we begin with an FCC nickel polycrystal sample, consisting of roughly 5 million atoms and roughly 600 grains; microstructure was initialized using a Voronoi tessellation. The sample is heated until 85% of its bulk melting temperature and allowed to anneal for roughly 1.5 nanoseconds, in femtosecond time-steps. Atoms with FCC types are not shown; of the remaining atoms, those with HCP types are colored blue, and the remainder are colored red.
Individual AtomEye cfg files were saved once per picosecond; images were made using an AtomEye animation script, and the images were sequenced using ffmpeg.
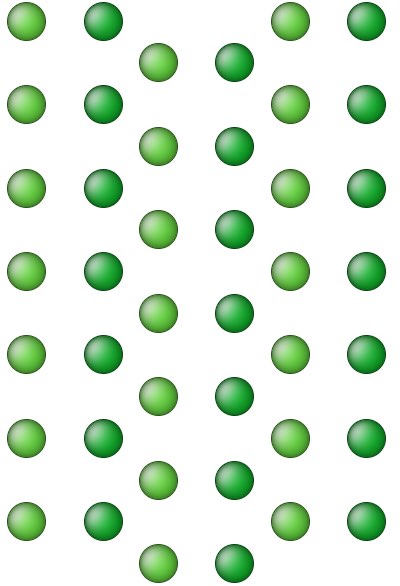
High-temperature 2D crystalsIn this example, we use LAMMPS to simulate a high-temperature two-dimensional Lennard-Jones system consisting of two crystals with a combined 4284 atoms. The internal crystal is initially rotated from the bulk matrix by 11 degrees. With time, the boundary between the crystals contracts until the two crystals effectively merge. At the end, all that remain are two dislocations and a double-vacancy.
A filter for two-dimensional systems was used for this analysis.
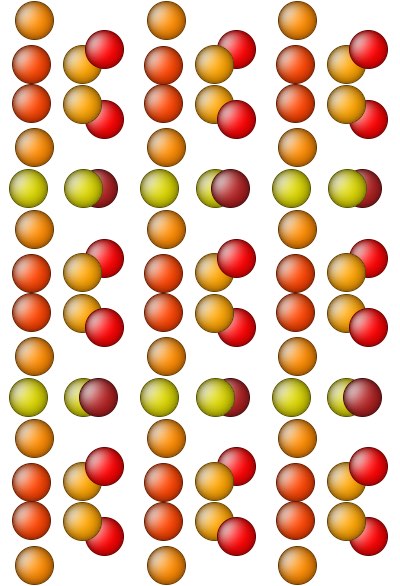
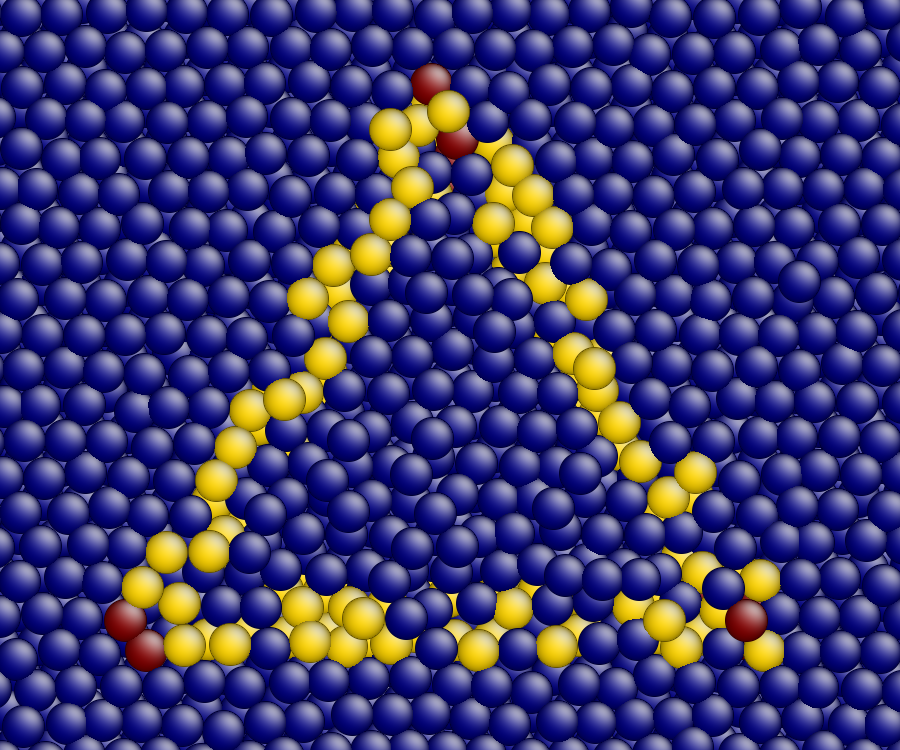
Defect Dynamics in a 2D CrystalIn this example, we use LAMMPS to simulate a high-temperature two-dimensional Lennard-Jones crystal with 1920 atoms. Although the bulk of the sample is crystalline, determined as atoms whose Voronoi cells have six edges, defects can also be seen.
A filter for two-dimensional systems was used for this analysis.